Welcome to the Activist Map
This platform designed to provide information about various events organized by protesters and activists worldwide. In an era where social and political movements are increasingly influential, Activist Map offers a resource to stay informed about rallies, demonstrations, and protest campaigns. Our goal is to help you explore the evolving landscape of social change, offering real-time updates and comprehensive event details. Activist Map serves as a neutral source for accessing information and gaining insight into the impact of collective action.
We have made changes:
We are excited to announce a significant enhancement to Activist Map! We have upgraded our platform to incorporate ESRI maps, providing you with a more powerful and interactive experience when tracking and exploring activist events. With ESRI's cutting-edge mapping technology, our website now offers improved visualization and geospatial analysis capabilities, making it easier than ever to navigate and understand the geographical aspects of various protests and demonstrations. This update empowers you to delve deeper into the locations, trends, and contexts of activist events, enhancing your ability to stay informed and engaged in the world of social and political activism. We are committed to continuously improving Activist Map to better serve your needs in staying connected with the evolving landscape of social change. Explore our upgraded platform today and discover the full potential of ESRI maps in understanding the movements that matter most to you.
Three Maps in One
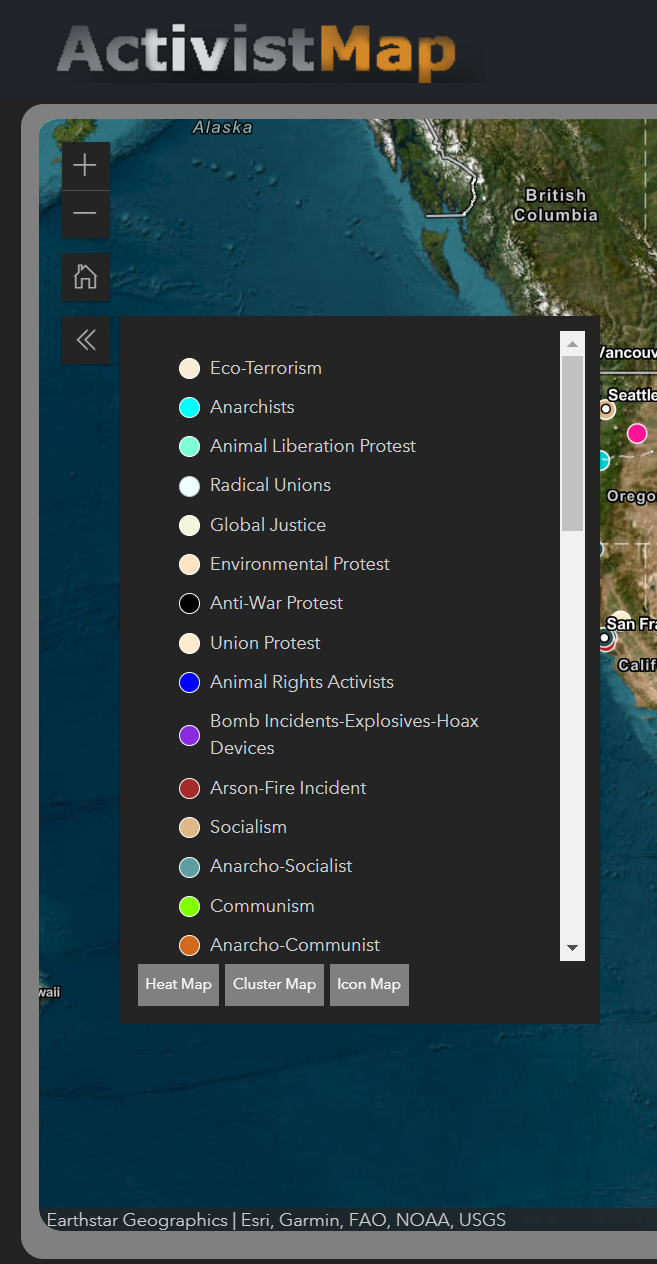
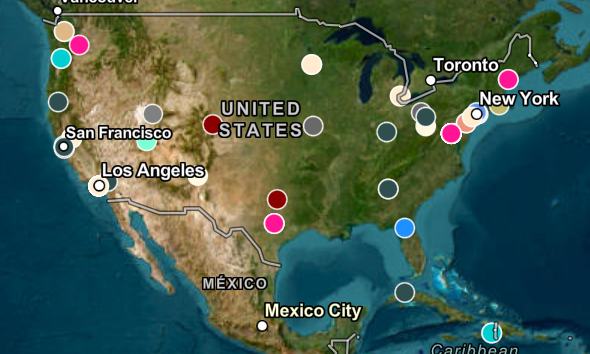
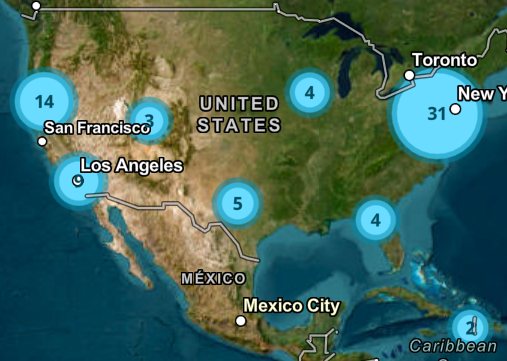
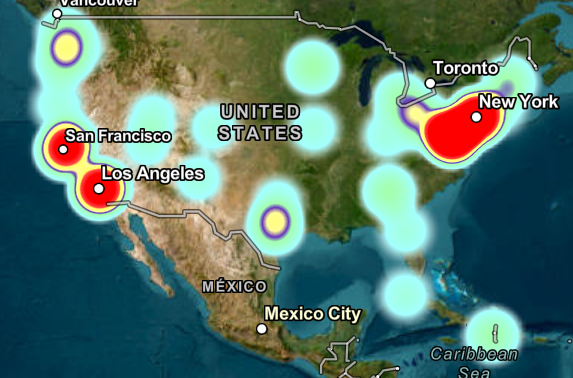
In addition to our integration of ESRI maps, we're thrilled to introduce three dynamic map types to enrich your browsing experience on Activist Map: Icon Map, Cluster Map, and Heat Map. These map variations provide diverse ways to visualize and interact with activist events. The Icon Map allows you to easily pinpoint individual events, offering detailed information at a glance. The Cluster Map groups nearby events to provide a comprehensive overview of activist hotspots, helping you identify trends and concentrations. Lastly, the Heat Map offers a visual representation of event density, highlighting areas where activism is most prominent. With these three map options, you can customize your experience to suit your preferences and gain deeper insights.
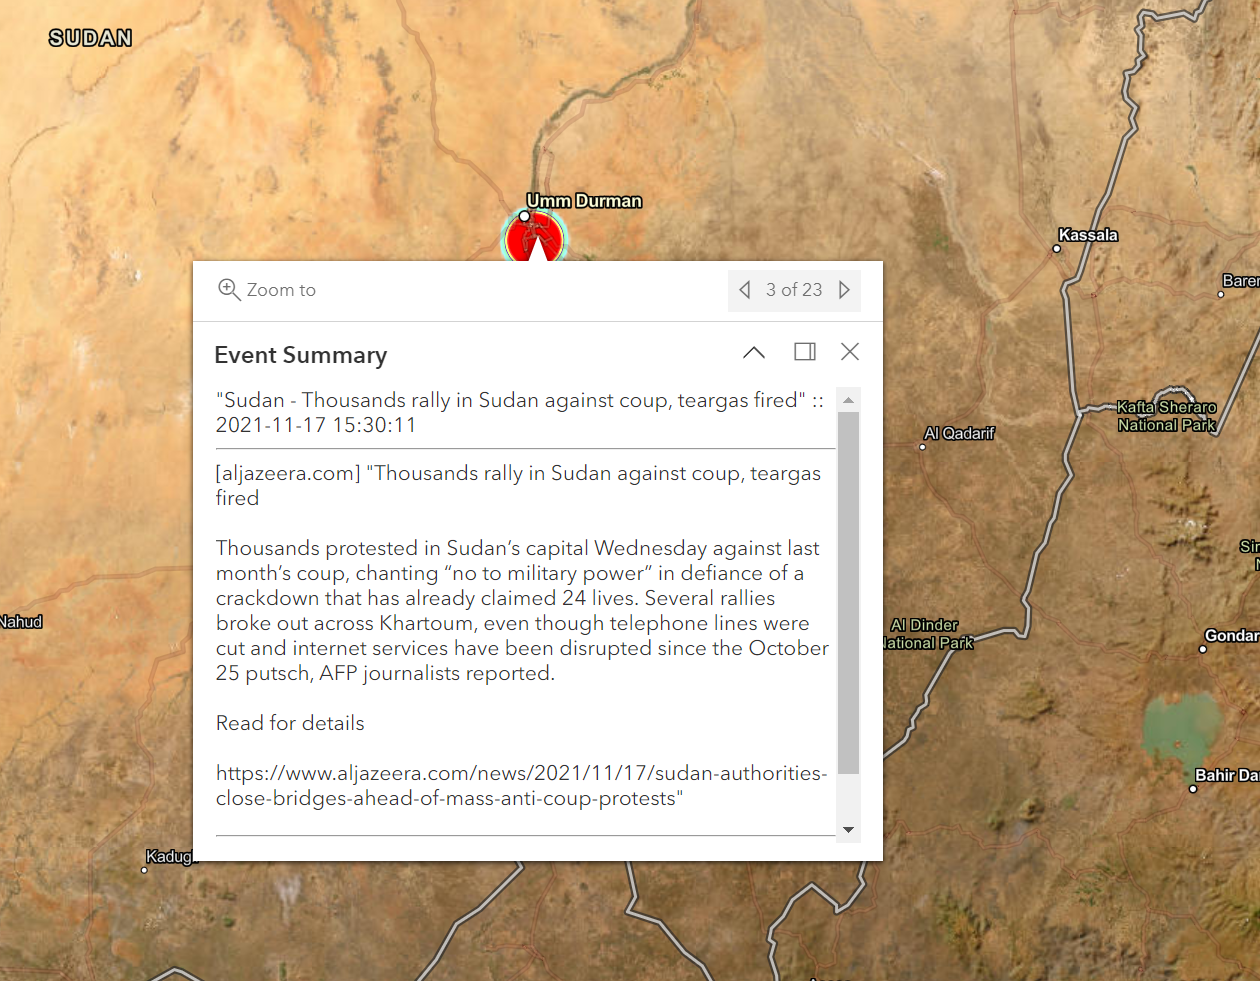
Main Maps
Cluster Maps
Heat Maps
Area Reports
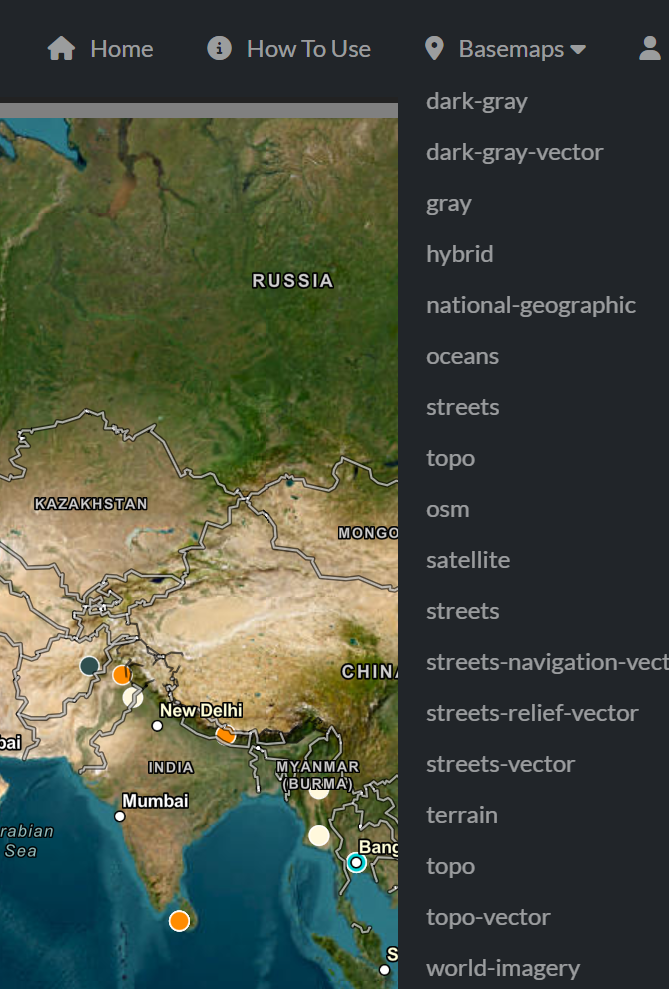
Basemaps
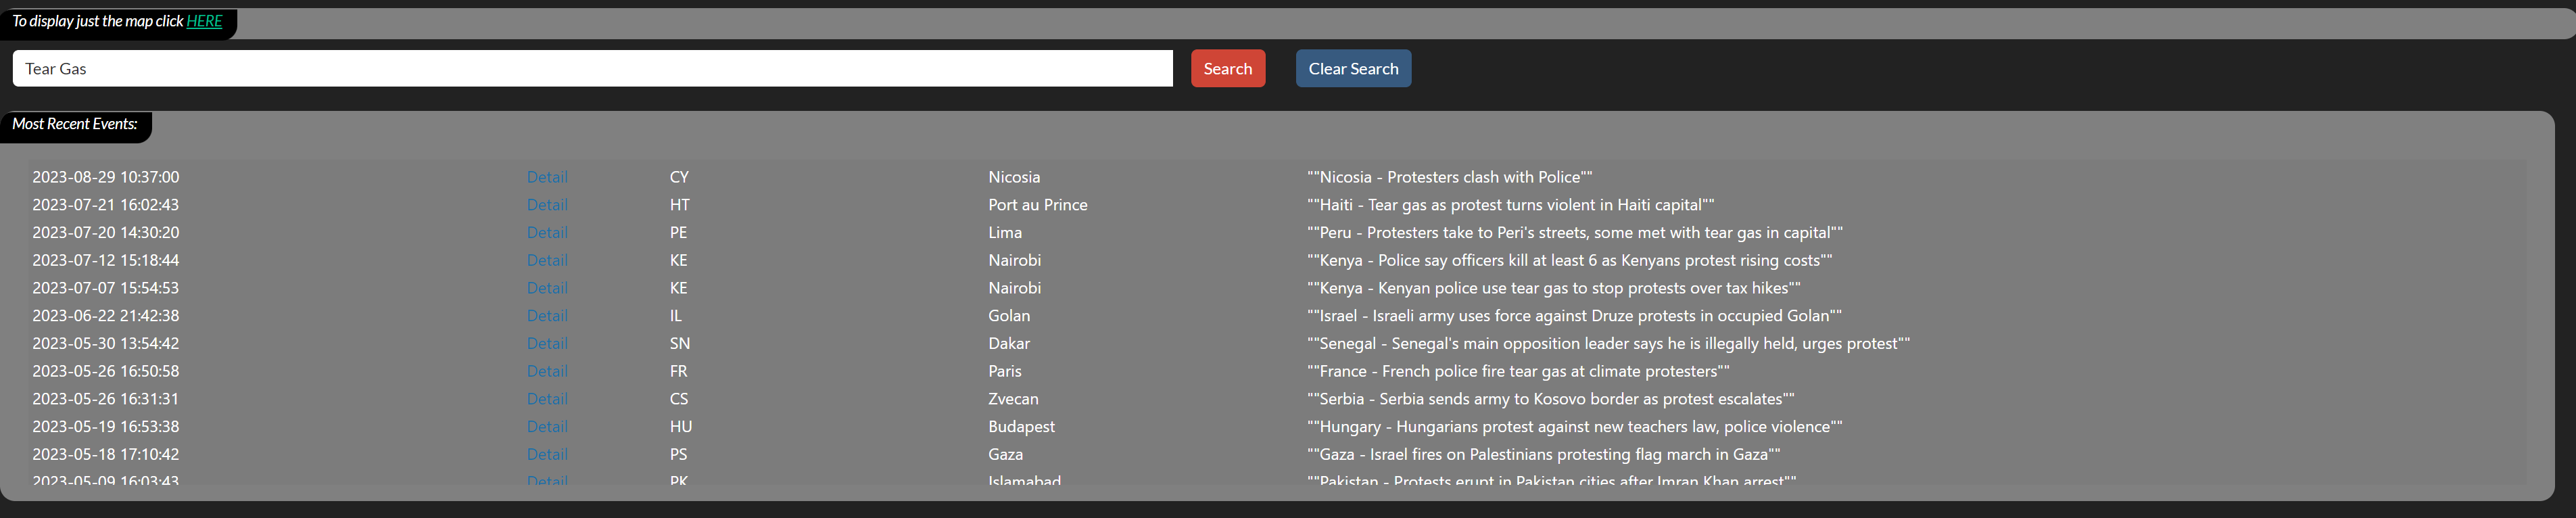
Dynamic Search
Fresh Content
We have changed the way the site refreshes. Instead of refreshing every five minutes, the site will first check if there is any new events in the database before it decides to refresh, this will reduce lag time on the site for all users.